Sikkim Population 2025
Sikkim state with its elegant natural beauty of snowing mountains, is an ever enchanting luxuriant forests with exotic flora and fauna, waterfalls, lakes, holy caves, hot springs ad, one of the biodiversity hotspots in the Eastern Himalayas. Sikkim is the state in north-eastern India, borders Nepal to the west, Bhutan to the east, China to the north, West Bengal to the south, Tibet in the north and northeast of which three sides are covered with Himalayan region. Sikkim population in 2025 is estimated to be 691 Thousands (6.91 Lakhs), By Aug 2023, Sikkim population is projected to be 6.89 Lakhs as per Unique Identification Aadhar India, updated 31, May 2023. As per NFHS 2019-2021 report, Total Fertility Rate of Sikkim State is 1.1 children per women compared to 1.2 in 2016. Sikkim is notable for its biodiversity, Mostly 35% of the Sikkim state is covered by the Khangchendzonga National Park, which includes the famous Kanchenjunga (8598 meters), the third highest peak in the world. The total area of the park is covered an area of 850 sq.km. The Sikkim state is being the part of inner mountain ranges of Himalayas is having hilly with varied elevations ranging from 300 meters to 7000 meters. The name Sikkim is believed to be the combination of two Limbu words 'Su', which means new, and 'khyim', which means house. It is the smallest state in India with 7,096 sq km and area rank is 28, density of Sikkim is 86 per sq km which is lower than national average 382 per sq km. The Lepcha people also called 'Rongkup' are considered to be the earliest inhabitants of Sikkim, they also found in the regions of Bhutan, Tibet and northern part of West Bengal. Sikkim accounts for the largest share of cardamom production in India. Sikkim has the major tourist spots in the north-eastern region of India, also popular for rejuvenate the mind and body with the beautiful landscapes of nature, The largest portion of Sikkim is in its North-West, a large number of mountains having the altitude of about 9000 meters stand here. Gangtok is the capital and the largest town of the Indian state of Sikkim. As on 2011, The total Sikkim population growth in this decade was 12.36 percent while in previous year in 2001 was 33.06 percent. As per 2011 census, out of this total population 25.15 per cent of the state population lives in urban areas while 74.85 per cent of the state population lives in the rural areas.
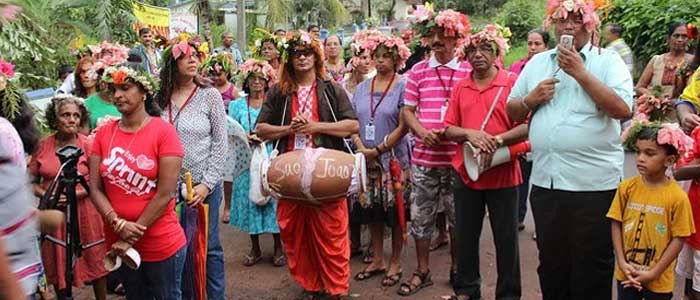
Image Source: Sikkim population gathering for Magh Sakranti, held at banks of rivers
| Census year | Persons | Absolute | Percentage | Males | Females |
|---|---|---|---|---|---|
| 1901 | 59,014 | - | - | 30,795 | 28,219 |
| 1911 | 87,920 | 28,906 | 48.98 | 45,059 | 42,861 |
| 1921 | 81,721 | -6,199 | -7.05 | 41,492 | 40,229 |
| 1931 | 109,808 | 28,087 | 34.37 | 55,825 | 53,983 |
| 1941 | 121,520 | 11,712 | 10.67 | 63,289 | 58,231 |
| 1951 | 137,725 | 16,205 | 13.34 | 72,210 | 65,515 |
| 1961 | 162,189 | 24,464 | 17.76 | 85,193 | 76,996 |
| 1971 | 209,843 | 47,654 | 29.38 | 112,662 | 97,181 |
| 1981 | 316,385 | 106,542 | 50.77 | 172,440 | 143,945 |
| 1991 | 406,457 | 90,072 | 28.47 | 216,427 | 190,030 |
| 2001 | 540,851 | 134,394 | 33.06 | 288,484 | 252,367 |
| 2011 | 610,577 | 69,726 | 12.89 | 323,070 | 287,507 |
Population Pyramid
Sikkim Population by Religion
The Rumtek monastery in Sikkim is most famous religious monuments. According to 2011 census, Hinduism is the major religion with 57.76%, followed by Buddhist with 27.39% and Christian with 9.9%. The total population of Hindu is 352,662 and Buddhist are 167,216.
| Religion | Persons | Percentage | Males | Females |
|---|---|---|---|---|
| Hindu | 352,662 | 57.76 | 189,972 | 162,690 |
| Muslim | 9,867 | 1.62 | 6,536 | 3,331 |
| Christian | 60,522 | 9.91 | 30,290 | 30,232 |
| Sikh | 1,868 | 0.31 | 1,592 | 276 |
| Buddhist | 167,216 | 27.39 | 85,302 | 81,914 |
| Jain | 314 | 0.05 | 181 | 133 |
| Others | 16,300 | 2.67 | 8,323 | 7,977 |
| Not Stated | 1,828 | 0.30 | 874 | 954 |
Ethnic groups of Sikkim
The tribe population of sikkim as per census 2011 are:
| Tribes | Population as per Census 2011 |
|---|---|
| All Scheduled Tribes | 206,360 |
| Bhutia (including Chumbipa, Dopthapa, Dukpa, Kagatey, Sherpa, Tibetan, Tromopa, Yolmo) | 69,598 |
| Lepcha | 42,909 |
| Limboo | 53,703 |
| Tamang | 37,696 |
| Generic Tribes etc. | 2,454 |
Languages spoken in Sikkim
The official languages of the Sikkim state are English, and the Himalayan language of Nepali, Sikkimese and Lepcha. The Lepcha is the have their own language and own script, derived from tibetan script and also called 'Rong'. Other than Sikkimese and Lepcha, other languages are Limbu, Rai, Sherpa and Tamang, Magar, Mukhia and Newari. According to 2011 census, Nepali is widely spoken language with 62.5% of the Sikkim population, followed by Hindi with 7.9%, Bhotia with 6.8%, Limbu with 6.3%, Lepcha with 6.2%, Sherpa with 2.2% and Tamang with 1.9%, Rai with 1.22% and Tibetan with 0.45%.
| Languages | Persons | Percentage | Rural | Urban |
|---|---|---|---|---|
| Nepali | 382,200 | 62.5965 | 291,531 | 90,669 |
| Hindi | 48,586 | 7.9574 | 17,938 | 30,648 |
| Bhotia | 41,889 | 6.8606 | 29,216 | 12,673 |
| Limbu | 38,733 | 6.3437 | 37,200 | 1,533 |
| Lepcha | 38,313 | 6.2749 | 34,545 | 3,768 |
| Sherpa | 13,681 | 2.2407 | 12,348 | 1,333 |
| Tamang | 11,734 | 1.9218 | 10,280 | 1,454 |
| Rai | 7,471 | 1.2236 | 6,999 | 472 |
| Bengali | 6,986 | 1.1442 | 2,956 | 4,030 |
| Tibetan | 2,785 | 0.4561 | 1,716 | 1,069 |
| Urdu | 2,001 | 0.3277 | 597 | 1,404 |
Disability
Below is the disable people statistics of the Sikkim state.
| Type of disability | Total Persons | Cultivators | Agriculture labor | HHI | Other workers |
|---|---|---|---|---|---|
| Total disabled population | 8,918 | 4,259 | 1,082 | 148 | 3,429 |
| In Seeing | 1,434 | 663 | 138 | 20 | 613 |
| In Hearing | 3,241 | 1,464 | 363 | 52 | 1,362 |
| In Speech | 790 | 420 | 153 | 8 | 209 |
| In Movement | 833 | 392 | 75 | 18 | 348 |
| Mental Retardation | 174 | 91 | 23 | 2 | 58 |
| Mental Illness | 167 | 98 | 28 | 6 | 35 |
| Any Other | 1,217 | 491 | 136 | 25 | 565 |
| Multiple disability | 1,062 | 640 | 166 | 17 | 239 |
Sikkim Population projection
Sikkim population in 2023 is estimated to be 690 Thousands, population in 2022 is estimated to be 683 Thousands (6.83 Lakhs), population in 2021 is estimated to be 677 Thousands (6.77 Lakhs), and in 2020 is estimated to be 690 Thousands (6.9 Lakhs).
District wise population in Sikkim
Sikkim is divided into 4 districts, South, East, West and North district. Below is the Sikkim district wise population as per Census 2011 and 2020 projection. North district is the largest with 4,226 sq.km in area but population figures, it is the smallest with 49,828. West district is the second largest 1166 sq.km in area but in term of population it is the third highest with 155,536, South district is the least 750 sq.km. in area with the population of 167,409. East district is the third highest with 954 sq.km in area the population is 323,285.
| District | Population(2020 est.) | Population(2011) | Percentage |
|---|---|---|---|
| North District | 49,828 | 43,709 | 7.16 |
| West District | 155,536 | 136,435 | 22.35 |
| South District | 167,409 | 146,850 | 24.05 |
| East District | 323,285 | 283,583 | 46.45 |
 India Population


