Andhra Pradesh Population 2024


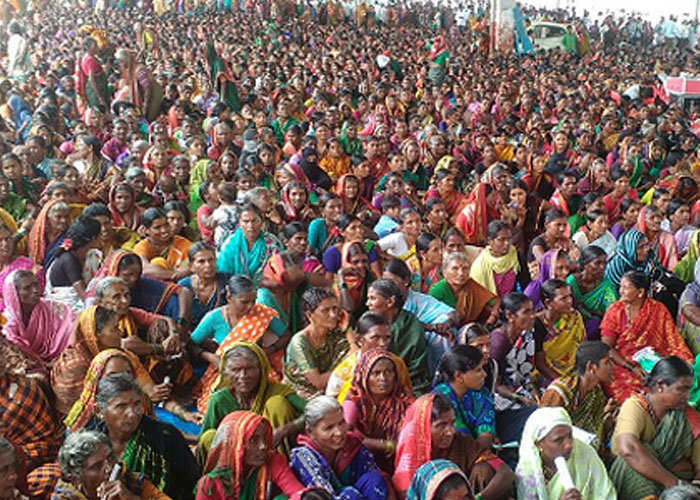
Image Source: Andhra people gathering at Tirupati meeting in 2019
| Census year | Persons | Absolute | Percentage | Males | Females |
|---|---|---|---|---|---|
| 1901 | 19,065,921 | - | - | 9,607,091 | 9,458,830 |
| 1911 | 21,447,412 | 2,381,491 | 12.49 | 10,769,322 | 10,678,090 |
| 1921 | 21,420,448 | -26,964 | -0.13 | 10,749,220 | 10,671,228 |
| 1931 | 24,203,573 | 2,783,125 | 12.99 | 12,183,673 | 12,019,900 |
| 1941 | 27,289,340 | 3,085,767 | 12.75 | 13,782,365 | 13,506,975 |
| 1951 | 31,115,259 | 3,825,919 | 14.02 | 15,670,565 | 15,444,694 |
| 1961 | 35,983,447 | 4,868,188 | 15.65 | 18,161,671 | 17,821,776 |
| 1971 | 43,502,708 | 7,519,261 | 20.9 | 22,008,663 | 21,494,045 |
| 1981 | 53,551,026 | 10,048,318 | 23.1 | 27,109,616 | 26,441,410 |
| 1991 | 66,508,008 | 12,956,982 | 24.2 | 33,724,581 | 32,783,427 |
| 2001 | 76,210,007 | 9,701,999 | 14.59 | 38,527,413 | 37,682,594 |
| 2011 | 84,580,777 | 8,370,770 | 10.98 | 42,442,146 | 42,138,631 |
Population Pyramid
Andhra Pradesh population pyramid and bifurcation of Telangana and Andhra Pradesh estimates as on 2011 census, illustrates the below graph, with the wide base suggests growing population, with a narrow base indicates declining birth rates.
Andhra Pradesh Population by Religion
As per 2011 census Andhra Pradesh religion wise befor bifurcation, 44.5 million are Hindus, 3.5 millions are Muslims, 676 thousand are Christians and 210 thousand belongs to Sikhs, Jains, Buddhists. Source: Details of Religion In Main Table C-1- 2011 (India & States/UTs)
Ethnic groups of Andhra Pradesh
The Scheduled Tribes Orders Act, 1976 have notified 33 ST's in the Andhra Pradesh state. Out of the 33 STs, five namely, Goudu, Malis, Nayaks, Thoti and Valmiki have been notified with an area restriction. Goudu, Nayaks and Valmiki have been notified in the Agency tracts area, which comprises districts of Srikakulum, Vizianagaram, Visakhapatnam, East and West Godavari.
1. Koya Konda Reddi Region - Tribal areas of East and West Godavari districts. The Konda Reddis are inhabiting on either side of Godavari banks from Bhadrachalam area to Devipatnam and polavaram areas of East Godavari and West Godavari respectively.
2. Khond-Savara Region - Tribal areas of Visakhapatnam, Vizianagaram and Srikakulam districts. This region spreads from forest and hill tracts of Srikakulam and Visakhapatnam districts and these hill ranges form part of Eastern ghats.
3. Chenchu Region - The traditional habitat of Chenchus is found in contiguous forest tracts of Nallamalai hills in the districts of Kurnool, Prakasam and Guntur.
As per 2011 census, The tribes of Andra Pradesh and their population.
| Tribes | Population as per Census 2011 |
|---|---|
| All Scheduled Tribes | 2,631,145 |
| Andh, Sadhu Andh | 315 |
| Bagata | 132,577 |
| Bhil | 69 |
| Chenchu | 47,315 |
| Gadabas, Bodo Gadaba, Gutob Gadaba, Kallayi Gadaba, Parangi Gadaba, Kathera Gadaba, Kapu Gadaba | 37,798 |
| Gond, Naikpod, Rajgond, Koitur | 6,691 |
| Goudu (in the Agency tracts) | 7,061 |
| Hill Reddis | 157 |
| Jatapus | 126,659 |
| Kammara | 48,912 |
| Kattunayakan | 57 |
| Kolam, Kolawar | 107 |
| Konda Dhoras, Kubi | 210,509 |
| Konda Kapus | 10,054 |
| Kondareddis | 90,937 |
| Kondhs, Kodi, Kodhu, Desaya Kondhs, Dongria Kondhs, Kuttiya Kondhs, Tikiria Kondhs, Yenity Kondhs, Kuvinga | 102,378 |
| Kotia, Bentho Oriya, Bartika, Dulia, Holva, Sanrona, Sidhopaiko | 45,291 |
| Koya, Doli Koya, Gutta Koya, Kammara Koya, Musara Koya, Oddi Koya, Pattidi Koya, Rajah, Rasha Koya, Lingadhari Koya (ordinary), Kottu Koya, Bhine Koya, Rajkoya | 104,348 |
| Kulia | 385 |
| Malis (excluding Adilabad, Hyderabad, Karimnagar, Khammam, Mahbubnagar, Medak, Nalgonda, Nizamabad and Warangal districts) | 5,244 |
| Manna Dhora | 13,636 |
| Mukha Dhora, Nooka Dhora | 42,357 |
| Nayaks (in the Agency tracts)a | 1,870 |
| Pardhan | 47 |
| Porja, Parangiperja | 36,145 |
| Reddi Dhoras | 930 |
| Rona, Rena | 1,012 |
| Savaras, Kapu Savaras, Maliya Savaras, Khutto Savaras | 137,613 |
| Sugalis, Lambadis, Banjara | 361,520 |
| Valmiki (in the Scheduled Areas of Vishakhapatnam, Srikakulam, Vijayanagaram, East Godavari and West Godavari districts) | 70,513 |
| Yenadis, Chella Yenadi, Kappala Yenadi, Manchi Yenadi, Reddi Yenadi | 533,746 |
| Yerukulas, Koracha, Dabba Yerukula, Kunchapuri Yerukula, Uppu Yerukula | 375,209 |
| Nakkala, Kurvikaran | 4,584 |
| Dhulia, Paiko, Putiya (in the districts of Vishakhapatnam and Vijayanagaram) | 665 |
| Generic Tribes etc. | 74,498 |
Languages spoken in Andhra Pradesh
Telugu is popular and widely spoken language in Andhra Pradesh, with 98% of population speak Telugu with different regional dialects or yasa. The different regional telugu dialects are Konaseema yasa, Rayalaseema yasa, Srikakulam yasa, Nellore yasa and Telangana yasa. Telugu is based on Central-Dravidian language and is heavily influenced by Sanskrit. Telugu is the fourth most spoken language in India after Hindi, Bengali and Marathi. Sri Krishan Deva Raya, a popular telugu emperor in 15th century stated "దేశ à°à°¾à°·à°²à°‚దౠతెలà±à°—ౠలెసà±à°¸ - desa bhashalandu telugu lessa", which means Telugu is the beautiful and greatest of all the languages in the country. Many of the Telugu words usually end in vowels which makes the language very mellifluous. Source: 2011 Census: Language and Mother Tongue
Andhra Pradesh Population projection
Andhra Pradesh population in 2022 is estimated to be 53 Million, population in 2021 is estimated to be 54.6 Million (5.46 Crores), According to UID, in 2020 is estimated to be 54 Million (5.4 Crores), and population in 2023 is estimated to be 53.2 million.
AP Population by Caste
Below is the list of Andhra Pradesh population by Castes in 2017:
| Caste | Percent |
|---|---|
| Backward Classes | 37% |
| Yadava | 6.3% |
| Rajaka | 4.2% |
| Mutarasi | 3.3% |
| SettiBalija(Goud, Ediga, Srisayana, Yata) | 3.3% |
| Padmashali | 2.9% |
| Kammari | 2.1% |
| Devanga | 2.1% |
| Goundla | 2% |
| Vaddera | 1.9% |
| Mangali | 1.3% |
| Kuruma | 1% |
| Idiga | 1% |
| Others | 4% |
| Forward Classes | 33.2% |
| Kapu | 14.5% |
| Reddy | 6.6% |
| Kamma | 4.8% |
| Velama | 2.9% |
| Vysyas | 2.7% |
| Kshatriya | 1.2% |
| SC/ST | 22.8% |
| Mala/Madiga | 16.6% |
| Scheduled Tribes | 6.2% |
| Muslims | 8% |
| Christians | 1.5% * |
*The majority of SC's in Coastal Andhra are Converted Christians but are officially listed as Hindus to be eligible for reservation benefits. So the real christian population will be between 15 to 16%. As per the President’s Order 1950, Scheduled Castes who convert from Hindu to Christianity are being accorded BC C status and they lose SC reservation benefits.
ST population 6% and made up of bunch of different tribes like yerukala, Yanadi, Banjara, Konda dhora, Bagata, Koya etc. Of these the yanadi are the largest and makeup around 1.25 percentage of State population.
Income Distribution
Agriculture has been the major income source and main occupation for the state with 60% of population engaged in agriculture and related activities. Rice is the major food crop, Other important crops are Coconuts, Sugarcane, Cotton, Mango, Cooca, Maize, Tobacco, Pulses etc. Aqua-culture like Fish and Shrimp are also the major occupations in the coastals regions of Andhra Pradesh. The state had a medium sized industrial sector in Vishakapatnam, small sized secor in Guntur and Ananthpur. The major rivers are Godavari, Krishna, Penna, and Thungabhadra flow through the state and provide irrigation.
District wise population in Andhra Pradesh
Andhra Pradesh state is divided into 13 districts. Anantapur is the largest district with 19,130 sq km., Chittoor being the second largest with 15,152 sq km., Srikakulam is the smallest district area in Andhra Pradesh with 5,837 sq km. There are 9 coastal districts sharing the coastline of Bay of Bengal, 4 districts being non-coastal districts called as Rayalaseema(Cuddapah, Anantapur, Chittoor and Kurnool). East Godavari is the most populus district in Andhra Pradesh with a population of around 5 million. Below is the Andhra Pradesh district wise population as per Census 2011 and 2020 projection.
| District | Population(2020 est.) | Population(2011) | Percentage |
|---|---|---|---|
| Srikakulam | 3,081,550 | 2,703,114 | 5,516,559.18 |
| Vizianagaram | 2,672,700 | 2,344,474 | 4,784,640.82 |
| Visakhapatnam | 4,891,271 | 4,290,589 | 8,756,304.08 |
| East Godavari | 5,875,897 | 5,154,296 | 10,518,971.43 |
| West Godavari | 4,488,141 | 3,936,966 | 8,034,624.49 |
| Krishna | 5,149,834 | 4,517,398 | 9,219,179.59 |
| Guntur | 5,572,107 | 4,887,813 | 9,975,128.57 |
| Prakasam | 3,873,091 | 3,397,448 | 6,933,567.35 |
| Sri Potti Sriramulu Nellore | 3,378,455 | 2,963,557 | 6,048,075.51 |
| Y.S.R. | 3,286,015 | 2,882,469 | 5,882,589.80 |
| Kurnool | 4,620,948 | 4,053,463 | 8,272,373.47 |
| Anantapur | 4,652,509 | 4,081,148 | 8,328,873.47 |
| Chittoor | 4,758,433 | 4,174,064 | 8,518,497.96 |
 India Population


