Kerala Population 2025


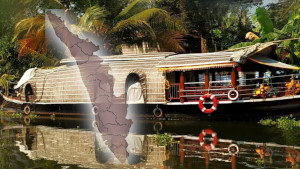
Source Image: Keraliates travelling in the ferry, backwaters of Kerala
| Census year | Persons | Absolute | Percentage | Males | Females |
|---|---|---|---|---|---|
| 1901 | 6,396,262 | - | - | 3,191,466 | 3,204,796 |
| 1911 | 7,147,673 | 751,411 | 11.75 | 3,559,425 | 3,588,248 |
| 1921 | 7,802,127 | 654,454 | 9.16 | 3,879,458 | 3,922,669 |
| 1931 | 9,507,050 | 1,704,923 | 21.85 | 4,702,951 | 4,804,099 |
| 1941 | 11,031,541 | 1,524,491 | 16.04 | 5,443,296 | 5,588,245 |
| 1951 | 13,549,118 | 2,517,577 | 22.82 | 6,681,901 | 6,867,217 |
| 1961 | 16,903,715 | 3,354,597 | 24.76 | 8,361,927 | 8,541,788 |
| 1971 | 21,347,375 | 4,443,660 | 26.29 | 10,587,851 | 10,759,524 |
| 1981 | 25,453,680 | 4,106,305 | 19.24 | 12,527,767 | 12,925,913 |
| 1991 | 29,098,518 | 3,644,838 | 14.32 | 14,288,995 | 14,809,523 |
| 2001 | 31,841,374 | 2,742,856 | 9.43 | 15,468,614 | 16,372,760 |
| 2011 | 33,406,061 | 1,564,687 | 4.91 | 16,027,412 | 17,378,649 |
Population Pyramid
Kerala Population by Religion
The major religions of Kerala are Hindu, Islam, Christian. As per 2011 census Kerala population religion wise, Hinduism is with 54.7%, followed by Muslim with 26.5% and Christianity with 18.3%. Sikhs, Buddhists and Jains are below 5000 each and 95,773 people has not stated their religion or have no religious affiliation. The total muslim population 8.8 Million is the second largest after Hindu population of 18.2 million, followed by Christian accounts for 6.1 million, the third largest religious community.
| Religion | Persons | Percentage | Males | Females |
|---|---|---|---|---|
| Hindu | 18,282,492 | 54.73 | 8,803,455 | 9,479,037 |
| Muslim | 8,873,472 | 26.56 | 4,176,255 | 4,697,217 |
| Christian | 6,141,269 | 18.38 | 2,993,781 | 3,147,488 |
| Sikh | 3,814 | 0.01 | 2,173 | 1,641 |
| Buddhist | 4,752 | 0.01 | 2,442 | 2,310 |
| Jain | 4,489 | 0.01 | 2,225 | 2,264 |
| Others | 7,618 | 0.02 | 4,114 | 3,504 |
| Not Stated | 88,155 | 0.26 | 42,967 | 45,188 |
Ethnic groups of Kerala
| Tribes | Population as per Census 2011 |
|---|---|
| All Scheduled Tribes | 484,839 |
| Adiyan | 11,526 |
| Arandan, Aranadan | 283 |
| Eravallan | 4,797 |
| Hill Pulaya, Mala Pulayan, Kurumba Pulayan, Karavazhi Pulayan, Pamba Pulayan | 2,959 |
| Irular, Irulan | 23,721 |
| Kadar, Wayanad Kadar | 2,949 |
| Kanikaran, Kanikkar | 21,251 |
| Kattunayakan | 18,199 |
| Kochuvelan | 38 |
| Koraga | 1,582 |
| Kudiya, Melakudi | 785 |
| Kurichchan, Kurichiyan | 35,171 |
| Kurumans, Mullu Kuruman, Mulla Kuruman, Mala Kuruman | 24,505 |
| Kurumbas, Kurumbar, Kurumban | 2,586 |
| Maha Malasar | 154 |
| Malai Arayan, Mala Arayan | 33,216 |
| Malai Pandaram | 2,422 |
| Malai Vedan, Malavedan | 8,149 |
| Malakkuravan | 175 |
| Malasar | 3,195 |
| Malayan, Nattu Malayan, Konga Malayan (excluding the areas comprising the Kasargode, Connanore, Wayanad and Kozhikode districts) | 5,917 |
| Malayarayar | 1,568 |
| Mannan (to be spelt in Malayalam script in parenthesis) | 9,780 |
| Muthuvan, Mudugar, Muduvan | 23,746 |
| Palleyan, Palliyan, Palliyar, Paliyan | 1,464 |
| Paniyan | 88,450 |
| Ulladan, Ullatan | 16,230 |
| Uraly | 11,179 |
| Mala Vettuvan (in Kasargode and Kannur districts) | 17,869 |
| Ten Kurumban, Jenu Kurumban | 25 |
| Thachanadan, Thachanadan Moopan | 1,745 |
| Cholanaickan | 124 |
| Mavilan | 30,867 |
| Karimpalan | 14,098 |
| Vetta Kuruman | 739 |
| Mala Panickar | 1,023 |
| Generic Tribes etc. | 62,352 |
Languages spoken in Kerala
| Languages | Persons | Percentage | Rural | Urban |
|---|---|---|---|---|
| Malayalam | 32,413,213 | 97.0279 | 16,867,245 | 15,545,968 |
| Tamil | 502,516 | 1.5043 | 346,256 | 156,260 |
| Tulu | 124,266 | 0.3720 | 91,046 | 33,220 |
| Kannada | 86,995 | 0.2604 | 58,195 | 28,800 |
| Konkani | 69,449 | 0.2079 | 16,312 | 53,137 |
| Hindi | 51,928 | 0.1554 | 12,428 | 39,500 |
| Telugu | 35,380 | 0.1059 | 17,678 | 17,702 |
| Marathi | 31,642 | 0.0947 | 23,942 | 7,700 |
| Bengali | 29,061 | 0.0870 | 12,285 | 16,776 |
| Urdu | 13,122 | 0.0393 | 4,002 | 9,120 |
| Odia | 10,958 | 0.0328 | 4,123 | 6,835 |
| Assamese | 5,796 | 0.0174 | 3,053 | 2,743 |
| Gujarati | 4,710 | 0.0141 | 352 | 4,358 |
| Nepali | 3,665 | 0.0110 | 1,026 | 2,639 |
| Bhili | 3,458 | 0.0104 | 3,187 | 271 |
Disability
Below is the disbale population of Kerala state as per table below.
| Type of disability | Total Persons | Cultivators | Agriculture labor | HHI | Other workers |
|---|---|---|---|---|---|
| Total disabled population | 179,694 | 12,517 | 23,281 | 5,556 | 138,340 |
| In Seeing | 31,467 | 2,817 | 4,862 | 994 | 22,794 |
| In Hearing | 30,572 | 2,370 | 4,609 | 1,112 | 22,481 |
| In Speech | 12,793 | 787 | 1,809 | 366 | 9,831 |
| In Movement | 48,863 | 2,688 | 4,176 | 1,325 | 40,674 |
| Mental Retardation | 4,548 | 373 | 693 | 126 | 3,356 |
| Mental Illness | 9,429 | 656 | 1,570 | 294 | 6,909 |
| Any Other | 29,102 | 1,899 | 3,728 | 914 | 22,561 |
| Multiple disability | 12,920 | 927 | 1,834 | 425 | 9,734 |
Kerala Population projection
Kerala population in 2022 is estimated to be 35.6 million (3.56 Crores), population in 2021 is estimated to be 35.4 million (3.54 Crores) and in 2020 is estimated to be 36.4 million (3.6 Crores), and population in 2023 is estimated to be 35.8 million.
District wise population in Kerala
Below is the Kerala district wise population as per Census 2011 and 2020 projection. Kerala is divided into 14 districts with the capital being Trivandrum also called Thiruvananthapuram, density is 4500 people per sq km. Palakkad is the largest district with 4480 sq km. Alappuzha is the smallest district with 1414 sq km. In Census 2011, Kottayam district has registered the highest literacy rate of 97.17% compared to Kerala's overall 94%.
| District | Population(2020 est.) | Population(2011) | Percentage |
|---|---|---|---|
| Kasaragod | 1,490,408 | 1,307,375 | 3.91 |
| Kannur | 2,876,223 | 2,523,003 | 7.55 |
| Wayanad | 931,859 | 817,420 | 2.45 |
| Kozhikode | 3,518,374 | 3,086,293 | 9.24 |
| Malappuram | 4,688,729 | 4,112,920 | 12.31 |
| Palakkad | 3,203,325 | 2,809,934 | 8.41 |
| Thrissur | 3,558,168 | 3,121,200 | 9.34 |
| Ernakulam | 3,741,922 | 3,282,388 | 9.83 |
| Idukki | 1,264,230 | 1,108,974 | 3.32 |
| Kottayam | 2,250,988 | 1,974,551 | 5.91 |
| Alappuzha | 2,425,679 | 2,127,789 | 6.37 |
| Pathanamthitta | 1,365,050 | 1,197,412 | 3.58 |
| Kollam | 3,004,328 | 2,635,375 | 7.89 |
| Thiruvananthapuram | 3,763,627 | 3,301,427 | 9.88 |
 India Population


