Punjab Population 2025


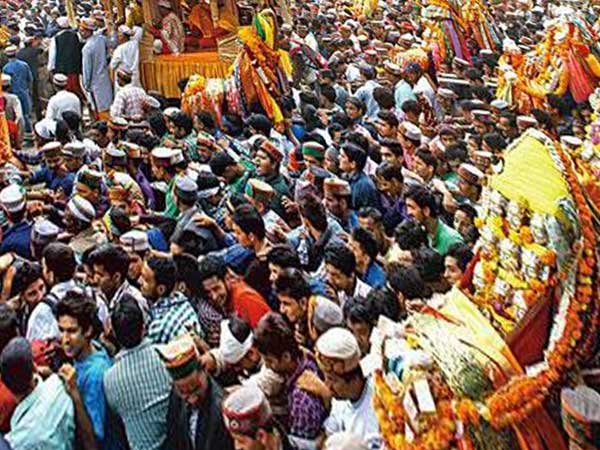
Image Source: Punjabi's gathering at Amritsar
| Census year | Persons | Absolute | Percentage | Males | Females |
|---|---|---|---|---|---|
| 1901 | 7,544,790 | - | - | 4,118,386 | 3,426,404 |
| 1911 | 6,731,510 | -813,280 | -10.78 | 3,782,236 | 2,949,274 |
| 1921 | 7,152,811 | 421,301 | 6.26 | 3,976,180 | 3,176,631 |
| 1931 | 8,012,325 | 859,514 | 12.02 | 4,415,292 | 3,597,033 |
| 1941 | 9,600,236 | 1,587,911 | 19.82 | 5,228,280 | 4,371,956 |
| 1951 | 9,160,500 | -439,736 | -4.58 | 4,968,206 | 4,192,294 |
| 1961 | 11,135,069 | 1,974,569 | 21.56 | 6,007,566 | 5,127,503 |
| 1971 | 13,551,060 | 2,415,991 | 21.7 | 7,266,515 | 6,284,545 |
| 1981 | 16,788,915 | 3,237,855 | 23.89 | 8,937,210 | 7,851,705 |
| 1991 | 20,281,969 | 3,493,054 | 20.81 | 10,778,034 | 9,503,935 |
| 2001 | 24,358,999 | 4,077,030 | 20.1 | 12,985,045 | 11,373,954 |
| 2011 | 27,743,338 | 3,384,339 | 13.89 | 14,639,465 | 13,103,873 |
Population Pyramid
Punjab Population by Religion
As per 2011 census Punjab Population Religion wise, Sikh is the main religion in Punjab with 16 million(57%), followed by Hindu with 10 million(38%), Muslims, Christians, Buddhists and Jains share less than 4% of the total Punjab population. Among the Indian Punjabi's 60% of the population related to Sikhism and 38% related to Hinduism.
| Religion | Persons | Percentage | Males | Females |
|---|---|---|---|---|
| Hindu | 10,678,138 | 38.49 | 5,683,894 | 4,994,244 |
| Muslim | 535,489 | 1.93 | 287,534 | 247,955 |
| Christian | 348,230 | 1.26 | 182,041 | 166,189 |
| Sikh | 16,004,754 | 57.69 | 8,395,797 | 7,608,957 |
| Buddhist | 33,237 | 0.12 | 17,176 | 16,061 |
| Jain | 45,040 | 0.16 | 23,560 | 21,480 |
| Others | 10,886 | 0.04 | 5,735 | 5,151 |
| Not Stated | 87,564 | 0.32 | 43,728 | 43,836 |
Languages spoken in Punjab
Punjabi is the main language with 89.81% of the population, around 25 millions speak Punjabi, followed by Hindi with 9.35% (2.5 million).
| Languages | Persons | Percentage | Rural | Urban |
|---|---|---|---|---|
| Punjabi | 24,917,885 | 89.8157 | 16,534,663 | 8,383,222 |
| Hindi | 2,594,831 | 9.3530 | 759,095 | 1,835,736 |
| Urdu | 27,387 | 0.0987 | 10,715 | 16,672 |
| Bengali | 27,030 | 0.0974 | 5,510 | 21,520 |
| Nepali | 22,061 | 0.0795 | 4,688 | 17,373 |
| Marathi | 20,392 | 0.0735 | 1,674 | 18,718 |
| Dogri | 18,155 | 0.0654 | 6,668 | 11,487 |
| Gujarati | 13,531 | 0.0488 | 2,954 | 10,577 |
| Tamil | 10,389 | 0.0374 | 1,333 | 9,056 |
| Odia | 9,969 | 0.0359 | 1,661 | 8,308 |
| Malayalam | 9,734 | 0.0351 | 944 | 8,790 |
| Telugu | 9,523 | 0.0343 | 961 | 8,562 |
| Maithili | 9,054 | 0.0326 | 2,546 | 6,508 |
| Assamese | 4,090 | 0.0147 | 596 | 3,494 |
| Kannada | 3,899 | 0.0141 | 600 | 3,299 |
| Kashmiri | 2,913 | 0.0105 | 593 | 2,320 |
Disability
Below table is the disable people stats of Punjab.
| Type of disability | Total Persons | Cultivators | Agriculture labor | HHI | Other workers |
|---|---|---|---|---|---|
| Total disabled population | 216,320 | 40,112 | 38,180 | 10,897 | 127,131 |
| In Seeing | 26,511 | 5,139 | 4,691 | 1,128 | 15,553 |
| In Hearing | 54,120 | 9,468 | 8,900 | 3,295 | 32,457 |
| In Speech | 7,259 | 1,621 | 1,172 | 305 | 4,161 |
| In Movement | 46,758 | 8,186 | 7,688 | 2,020 | 28,864 |
| Mental Retardation | 7,490 | 1,524 | 1,590 | 359 | 4,017 |
| Mental Illness | 3,568 | 859 | 816 | 134 | 1,759 |
| Any Other | 65,468 | 12,209 | 12,422 | 3,418 | 37,419 |
| Multiple disability | 5,146 | 1,106 | 901 | 238 | 2,901 |
Punjab Population projection
According to UID, Punjab population in 2022 is estimated to be 30.6 Million (3.06 Crores), in 2021 is estimated to be 30.49 Million (3 Crores), population in 2020 is 30 Million (3 Crores) and population in 2023 is estimated to be 30.74 Million.
District wise population in Punjab
Punjab is divided into 22 districts, Ludhiana is the most populated district with 3.91 million(2019) in the punjab state and Barnala is the least populated district (0.6 million). Firozepur is the largest district in the Punjab state with 2,190 sq km while Kapurthala is the smallest district with 1,633 sq km. Below table illustrates Punjab Population district wise.
| District | Population(2020 est.) | Population(2011) | Percentage |
|---|---|---|---|
| Gurdaspur | 2,620,088 | 2,298,323 | 8.28 |
| Kapurthala | 929,292 | 815,168 | 2.94 |
| Jalandhar | 2,500,693 | 2,193,590 | 7.91 |
| Hoshiarpur | 1,808,753 | 1,586,625 | 5.72 |
| Shahid Bhagat Singh Nagar | 698,033 | 612,310 | 2.21 |
| Fatehgarh Sahib | 684,186 | 600,163 | 2.16 |
| Ludhiana | 3,988,562 | 3,498,739 | 12.61 |
| Moga | 1,135,150 | 995,746 | 3.59 |
| Firozpur | 2,313,144 | 2,029,074 | 7.31 |
| Muktsar | 1,028,161 | 901,896 | 3.25 |
| Faridkot | 703,959 | 617,508 | 2.23 |
| Bathinda | 1,582,919 | 1,388,525 | 5.00 |
| Mansa | 877,516 | 769,751 | 2.77 |
| Patiala | 2,161,082 | 1,895,686 | 6.83 |
| Amritsar | 2,839,348 | 2,490,656 | 8.98 |
| Tarn Taran | 1,276,375 | 1,119,627 | 4.04 |
| Rupnagar | 780,475 | 684,627 | 2.47 |
| Sahibzada Ajit Singh Nagar | 1,133,876 | 994,628 | 3.59 |
| Sangrur | 1,886,893 | 1,655,169 | 5.97 |
| Barnala | 678,901 | 595,527 | 2.15 |
 India Population


